All significance parameters can be customized for your company.
The console displays the critical Z value and the p-value, if needed.
Conversion & growth
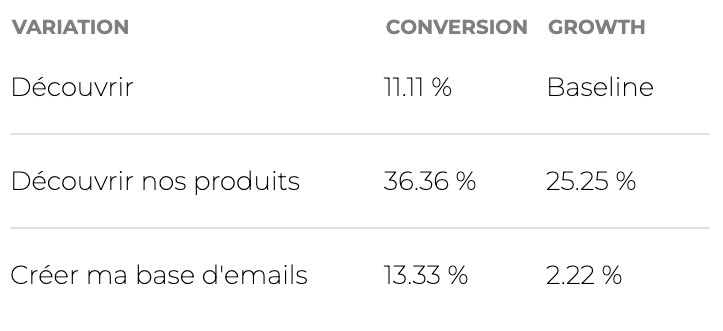
baseline, which represents the original wording being tested.
Hover over the conversion or growth metrics for detailed figures.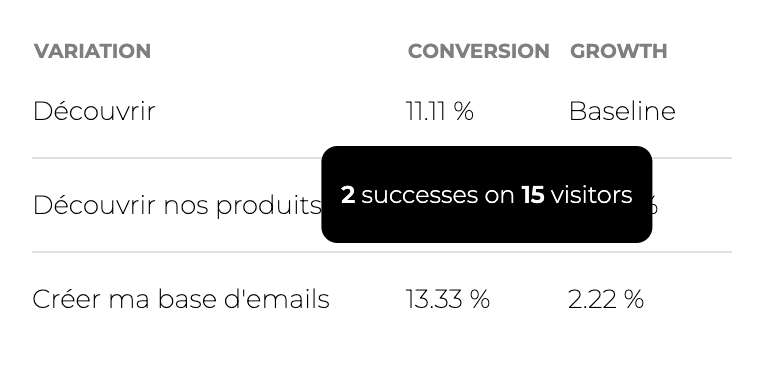
Common Questions About Statistics
What do I need to consider for a successful test?
-
Traffic Volume:
- High-traffic websites can quickly achieve the necessary sample sizes.
- Low-traffic websites may need to run tests for extended periods to gather sufficient data.
-
Test Duration:
- Ensure the test runs long enough to collect the necessary sample size for accurate results.
- Account for seasonal or time-based variations in traffic and user behavior.
-
Multiple Variants:
- If testing more than two variants, the sample size calculation is updated to maintain statistical validity.
Do I have enough traffic on my website to run A/B tests?
You’ll need approximately 7,448 visitors for each variant to detect a 1% difference with 95% confidence and 80% power.
-
Sample Size:
- The number of visitors required to detect a meaningful difference between variants.
- Calculated using statistical formulas based on your desired confidence level and effect size.
-
Effect Size:
- The minimum detectable change in conversion rate or other metrics.
- Smaller effect sizes necessitate larger sample sizes.
-
Confidence Level:
- The probability that the test results are not due to random chance.
- Commonly used confidence levels are 95% and 99%.
n can be calculated using the following formula for two proportions:
n = Z_alphaZ_betappdelta
Where:
Z_alpha/2is theZ-valuefor the desired confidence level (e.g., 1.96 for 95% confidence).Z_betais theZ-valuefor the desired power (e.g., 0.84 for 80% power).pis the estimated overall conversion rate.deltais the minimum detectable effect size (difference between conversion rates of the control and variant).
To detect a 1% difference with 95% confidence and 80% power, you would need approximately 7,448 visitors per variant.
Example Calculation for a 1% difference
Example Calculation for a 1% difference
statistical-significance
Assume you have the following:
- Overall conversion rate (
p) = 5% (0.05) - Desired confidence level = 95% (
Z-value= 1.96) - Desired power = 80% (
Z-value= 0.84) - Minimum detectable effect size (
delta) = 1% (0.01)
n = n = You would need approximately 75 visitors for each variant to detect a 10% difference with 95% confidence and 80% power.
Example Calculation for a 10% difference
Example Calculation for a 10% difference
statistical-significance
Assume you have the following:
- Overall conversion rate (
p) = 5% (0.05) - Desired confidence level = 95% (
Z-value= 1.96) - Desired power = 80% (
Z-value= 0.84) - Minimum detectable effect size (
delta) = 10% (0.1)
n = n = What are some common examples of traffic and A/B testing statistics?
-
High-traffic website:
- Daily visitors: 50,000
- Estimated conversion rate: 5%
- Desired effect size: 1%
- Sample size per variant: 7,448
-
Low-traffic website:
- Daily visitors: 500
- Estimated conversion rate: 5%
- Desired effect size: 10%
- Sample size per variant: 75
How are variations split among visitors?
Currently, variations are equally distributed among visitors. For example, if you have three different variations in an experiment (including the baseline), one out of every three visitors will randomly see each variation.How can I change the significance thresholds for my company?
You can contact the team at support@gleef.eu.How can I segment the traffic and determine who sees an experiment?
Currently, we do not provide built-in segmentation capabilities. However, you can conduct your own segmentation by directing visitors to different URLs and implementing experiments on each specific URL.Can I remove the default text?
To conduct effective A/B testing, you should keep the text you’re experimenting with as the baseline. This serves as the reference point for all other variations tested.What kinds of success events can be set up?
We provide extensive information on success events on this page: Success events
-
Running an experiment on a Call to Action (CTA)
you can define the success event as either:
- A click on the specific item.
- A visit to a specific URL (a page view later in the funnel).
- Running an experiment on regular non-clickable text you can specify the relevant visit to a specific URL (a page view later in the funnel).
Retrieving Data from Experiments
We strive to provide all the essential information directly on your dashboard.How do I interpret the results of an A/B experiment?
Compare the performance metrics (e.g., conversion rates) of each variation against the control to determine the most effective copy. Gleef highlights the best-performing variation directly below the ‘baseline’, which represents the text you selected for the experiment.Does Gleef provide detailed statistical information on experiments?
We now display
p-value and Z-value for all experiments, as well as extensive data points we use to compute significance.